View the App Usage Report
See a breakdown of all apps
Select a platform:
The App Usage Report shows the name of every app captured by Accountable2You, along with the estimated "Total Time Used" for each app, which is determined by data from the Detailed Activity Report. A pie chart with colors matching the app names provides an "at-a-glance" view of approximately how much time the device user has spent in each app during the chosen timeframe. 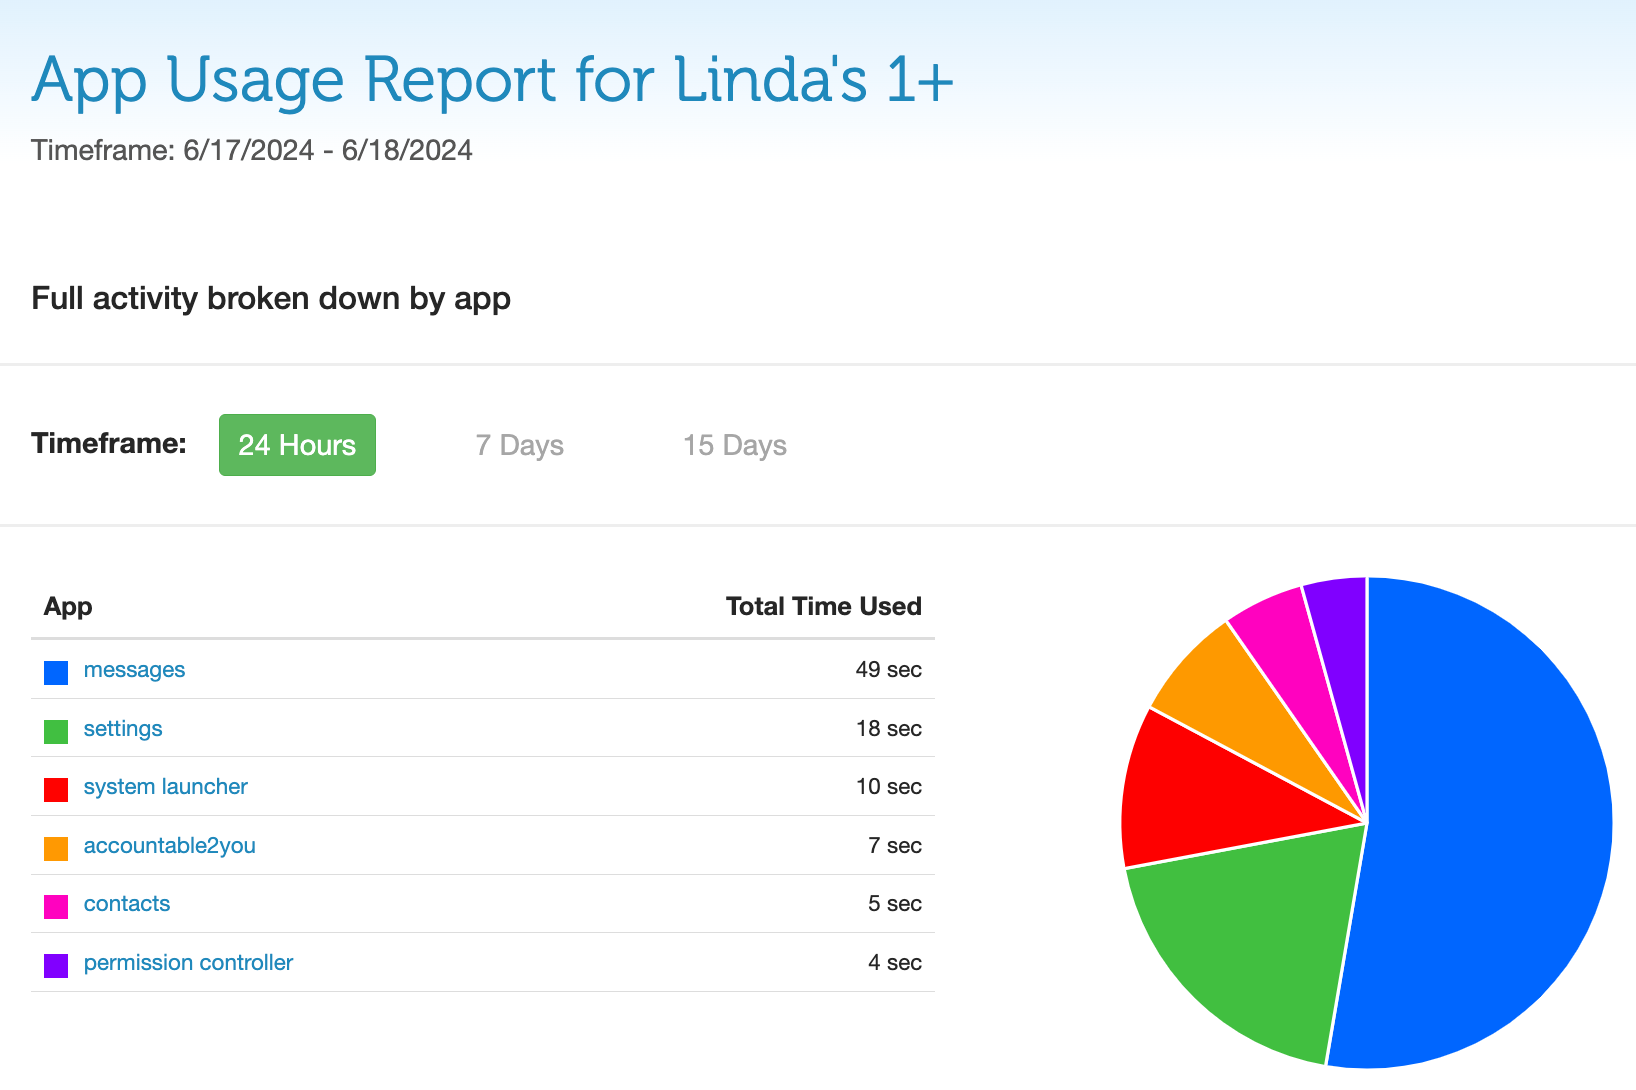
The App Usage Report shows the name of every app captured by Accountable2You, along with the estimated "Total Time Used" for each app, which is determined by data from the Detailed Activity Report. A chart listing the app names provides an "at-a-glance" view of approximately how much time the device user has spent in each app during the chosen timeframe. 
Background app activity
Sometimes, if apps are running in the background of a device, the Total Time Used amount may appear higher than the actual time the device user spent actively using those apps. If you see apps with usage times that seem higher than they should be, we recommend disabling background app permissions for those apps. This will help the total time listed for those apps to be more accurate.
While it varies by platform, iOS devices (iPhones and iPads) are especially known for skewing Total Time Used when these permissions are enabled. To disable the background permissions on an iPhone, open the Settings app and tap General > Background App Refresh. From there, you can turn the feature off completely (for all apps) or individually (for specific apps showing higher than expected "Total Time Used").
Dive into specific apps
Select a platform:
Selecting a specific app name under the "App" column of the App Usage Report will bring up a preview "App Activity" window on the same page, displaying all the records Accountable2You has captured from that particular app during the selected timeframe. You can also click a specific record within this App Activity window to be taken to a more detailed report showing the surrounding context of that specific app record. 
Selecting a specific app name under the "App" column of the App Usage Report will bring up an App Activity window, displaying all the records Accountable2You has captured from that particular app during the selected timeframe.

See devices usage patterns over time
Select a platform:
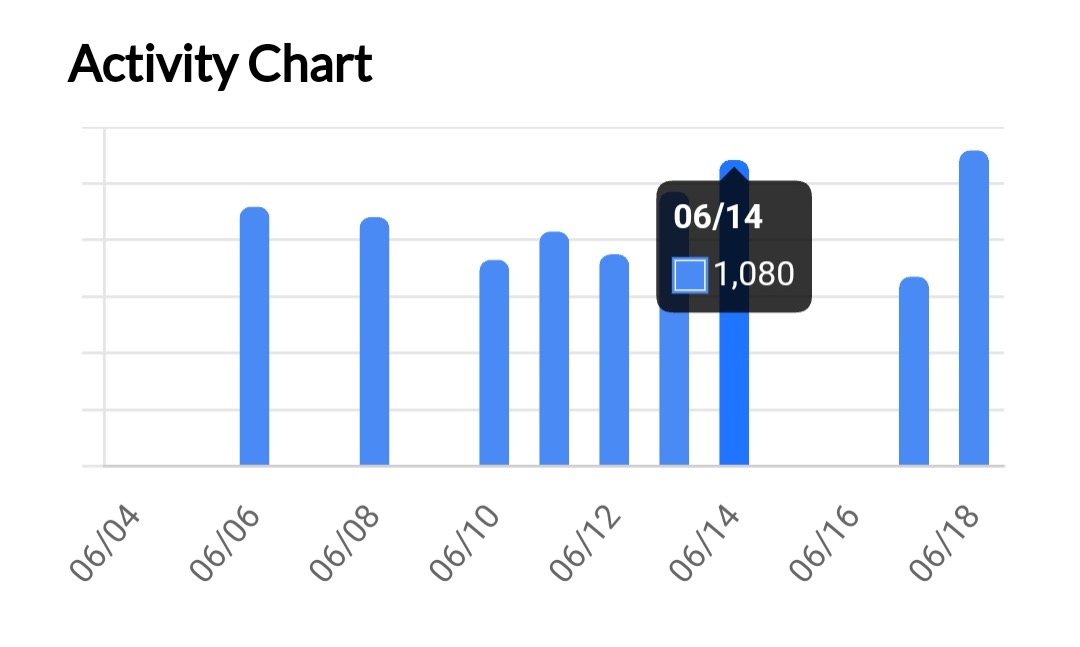
At the bottom of the App Usage Report, you’re presented with a timeline view showing the approximate volume of device usage over the selected period of time (24 hours, 7 days, or 15 days).
- If you have the 24-hour view selected, you'll see a summary of activity hour-by-hour during that time period.
- If you have the 7 or 15-day view selected, you'll see a summary of activity for each day during that time period.
In summary
To summarize, the App Usage Report gives an at-a-glance overview of app activity and also provides a great way to filter activity records, but it is not a representation of exact, second-by-second screen usage and interaction.
The information accessible from the App Usage Report is especially valuable in knowing what apps have been running on the device and when those apps have been in use. Providing this information supports our primary goal—to remove isolation for device users by bringing in an observer (a partner like yourself) to help influence better choices and decrease temptation.
Did you find what you’re looking for? Let us know!